Guide to the Cox Proportional Hazards Model with gbm3
James Hickey
2026-07-16
Source:vignettes/cox-proportional-hazards-guide.Rmd
cox-proportional-hazards-guide.Rmdgbm3 supports boosted Cox proportional hazards models
for survival data. The package can handle two types of survival
response: right-censored and counting-process Surv objects.
Both can be created with the Surv function from the
survival package.
Setting up data and the distribution object
Right-censored survival data consist of a time-to-event value and an
event indicator: 0 if no event has occurred and 1 if the event has
occurred. Counting-process survival data contain start and stop times
along with an event indicator for the interval. Data may be organized
into strata, which should be passed to gbm_dist when
creating the CoxPHGBMDist object; see the “Model Specific
Parameters” vignette for more details. The dataset used here is provided
by the survival package.
Creating a boosted model
To create the boosted model, define the training parameters and call
gbmt. In this example, the data have observation IDs, so it
is necessary to create specific GBMTrainParams objects
rather than relying on the defaults.
# Set-up training parameters
params_right_cens <- training_params(num_trees = 2000, interaction_depth = 3,
                                     id=right_cens$id,
                                     num_train=round(0.5 * length(unique(right_cens$id))) )
params_start_stop <- training_params(num_trees = 2000, interaction_depth = 3,
                                     id=start_stop$id,
                                     num_train=round(0.5 * length(unique(start_stop$id))) )

# Call to gbmt
fit_right_cens <- gbmt(Surv(tstop, status)~ age + sex + inherit +
                     steroids + propylac, data=right_cens,
                     distribution = right_cens_dist,
                     train_params = params_right_cens, cv_folds=10,
                     keep_gbm_data = TRUE)
fit_start_stop <- gbmt(Surv(tstart, tstop, status)~ age + sex + inherit +
                     steroids + propylac, data=start_stop,
                     distribution = start_stop_dist,
                     train_params = params_start_stop, cv_folds=10,
                     keep_gbm_data = TRUE)

# Plot performance
best_iter_right <- gbmt_performance(fit_right_cens, method='test')
best_iter_stop_start <- gbmt_performance(fit_start_stop, method='test')
Strata Updates
During fitting, the original strata vector is updated as follows.
When the data are split into training and validation sets, the strata
vector is also split. The strata vector is then updated to represent the
cumulative count of observations in each stratum for the training and
validation sets. The vector is padded with NAs so it has
the same length as the original strata vector and so that the
validation-set cumulative strata sums are separated from the
training-set strata counts by the appropriate amount.
The original strata vector is stored within the GBMFit
object and can be accessed as follows:
fit$distribution$original_strata_id. The data in the
original_strata_id field is used to recreate the correct
strata when performing additional iterations using
gbm_more.
Role of additional parameters in GBMDist
ties and prior_node_coeff_var
The ties and prior_node_coeff_var
parameters may also be specified on construction of the
CoxPHGBMDist object. The former is a string specifying the
method by which the algorithm deals with tied event times. This may be
set to either “breslow” or “efron” depending on your preference, with
the latter being the default. The role of the
prior_node_coeff_var parameter is slightly more subtle and
complex. When fitting a boosted tree, the optimal predictions of the
terminal nodes must be set. These predictions determine the predictions
made by the GBMFit object. The role of
prior_node_coeff_var is to ensure that the predictions are
finite and it does this by acting as a regularization for the terminal
node predictions. It should be a finite positive double and is by
default set to a 1000. An exact description of its role in the
underlying algorithm is described in the next section.
# Example using Breslow and Efron tie-breaking

# Create data
require(survival)

set.seed(1)
N <- 3000
X1 <- runif(N)
X2 <- runif(N)
X3 <- factor(sample(letters[1:4],N,replace=T))
mu <- c(-1,0,1,2)[as.numeric(X3)]

f <- 0.5*sin(3*X1 + 5*X2^2 + mu/10)
tt.surv <- rexp(N,exp(f))
tt.cens <- rexp(N,0.5)
delta <- as.numeric(tt.surv <= tt.cens)
tt <- apply(cbind(tt.surv,tt.cens),1,min)

# throw in some missing values
X1[sample(1:N,size=100)] <- NA
X3[sample(1:N,size=300)] <- NA

# random weights if you want to experiment with them
w <- rep(1,N)
data <- data.frame(tt=tt,delta=delta,X1=X1,X2=X2,X3=X3)

# Set up distribution objects
cox_breslow <- gbm_dist("CoxPH", ties="breslow", prior_node_coeff_var=100)
cox_efron <- gbm_dist("CoxPH", ties="efron", prior_node_coeff_var=100)

# Define training parameters
params <- training_params(num_trees=3000, interaction_depth=3, min_num_obs_in_node=10,
                          shrinkage=0.001, bag_fraction=0.5, id=seq(nrow(data)),
                          num_train=N/2, num_features=3)

# Fit gbm
fit_breslow <- gbmt(Surv(tt, delta)~X1+X2+X3, data=data, distribution=cox_breslow,
                    weights=w, train_params=params, var_monotone=c(0, 0, 0),
                    keep_gbm_data=TRUE, cv_folds=5, is_verbose = FALSE)

fit_efron <- gbmt(Surv(tt, delta)~X1+X2+X3, data=data, distribution=cox_efron,
                  weights=w, train_params=params, var_monotone=c(0, 0, 0),
                  keep_gbm_data=TRUE, cv_folds=5, is_verbose = FALSE)


# Evaluate fit
plot(gbmt_performance(fit_breslow, method='test'))
legend("topleft", c("training error", "test error", "optimal iteration"),
       lty=c(1, 1, 2), col=c("black", "red", "blue"))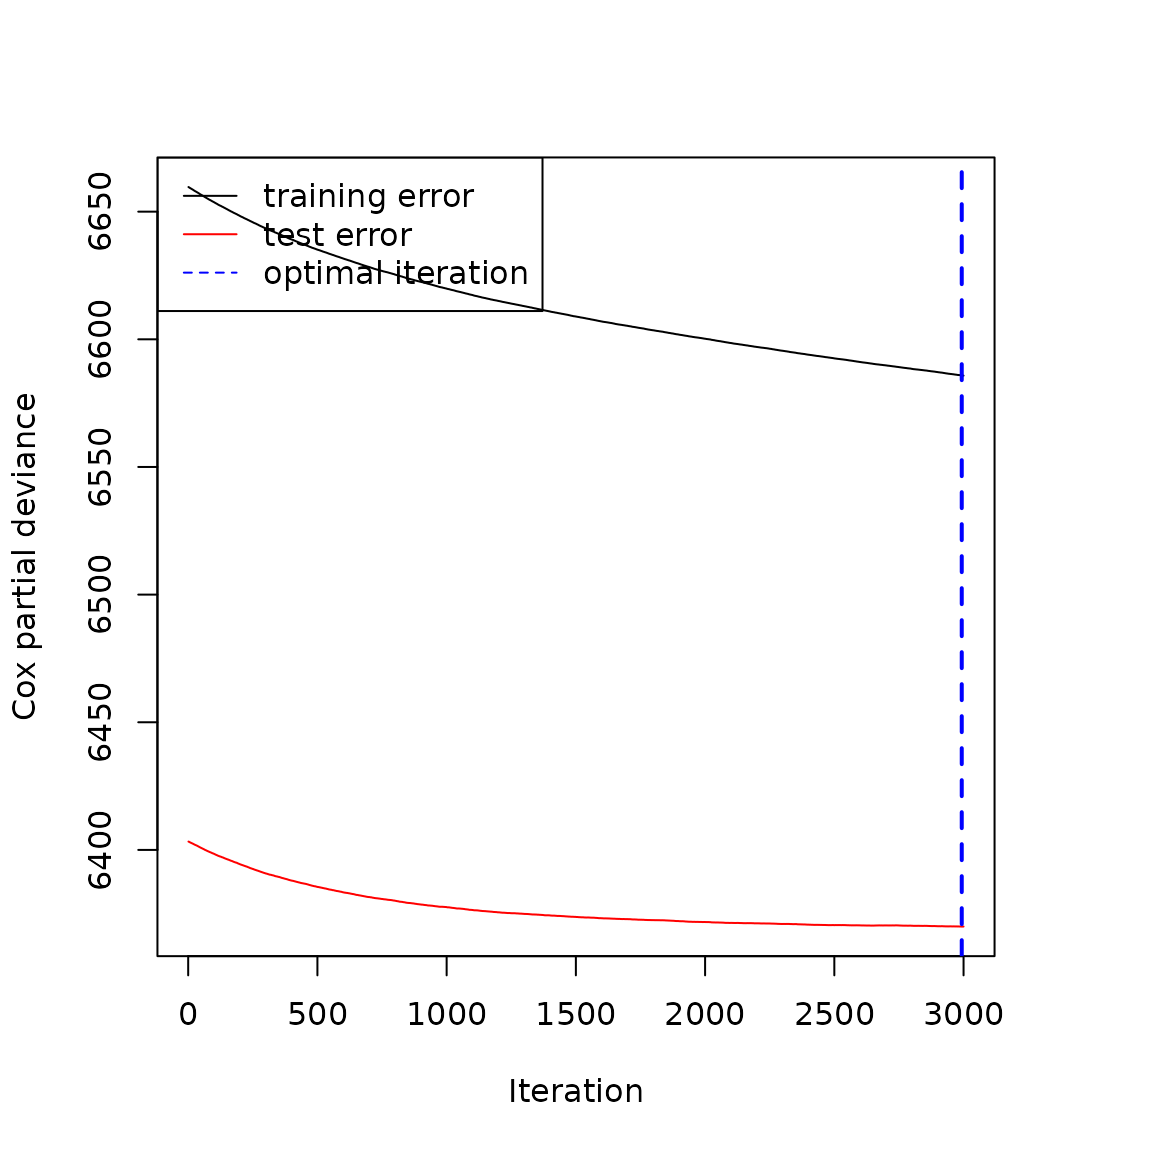
plot(gbmt_performance(fit_efron, method='test'))
legend("topleft", c("training error", "test error", "optimal iteration"),
       lty=c(1, 1, 2), col=c("black", "red", "blue"))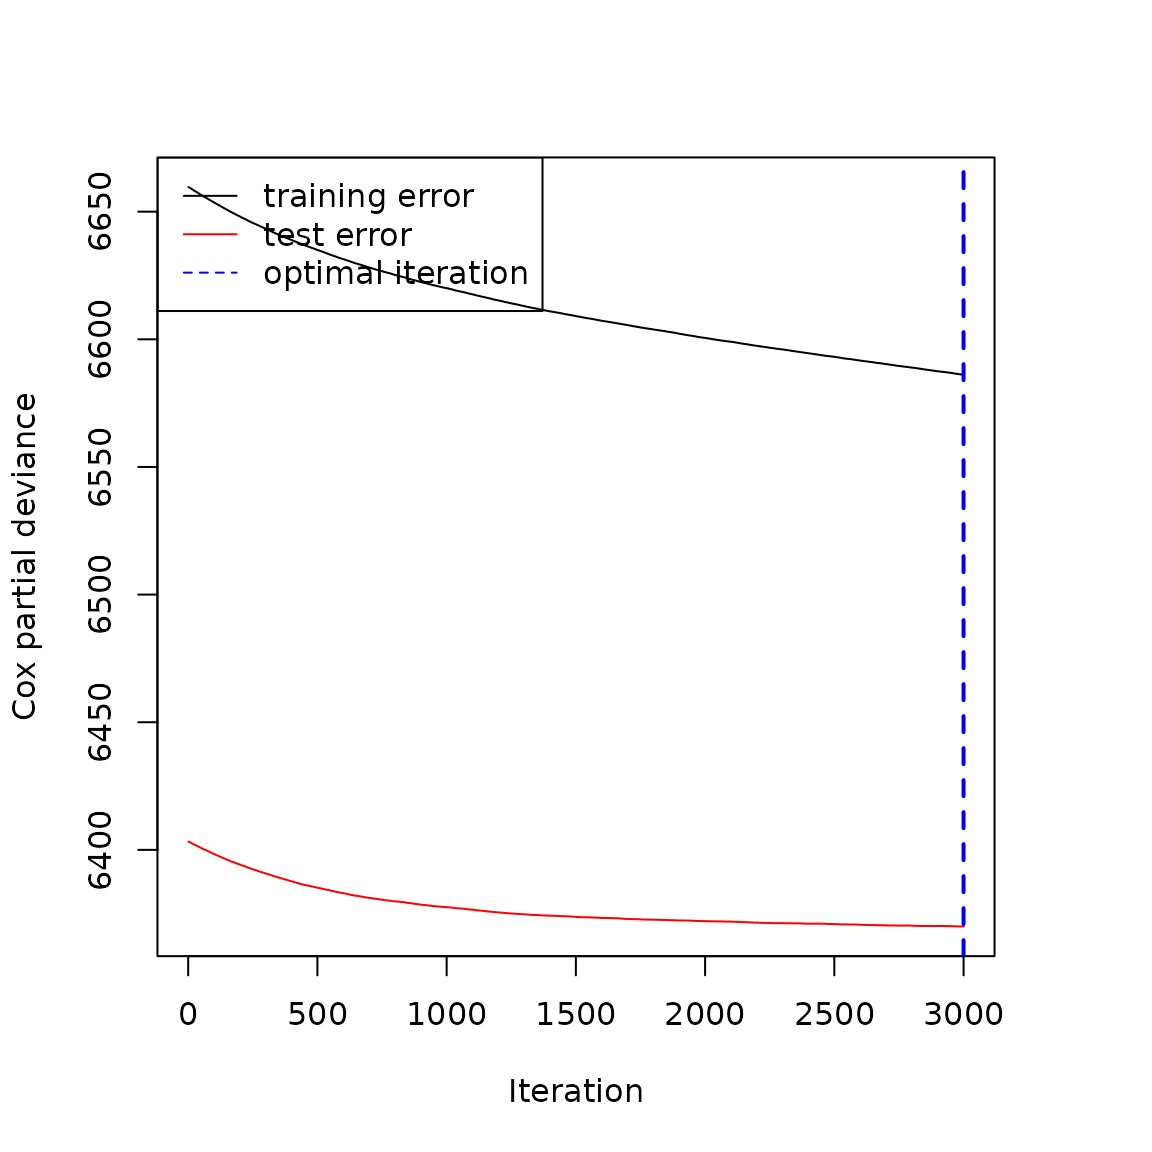
Description of the underlying algorithm - specifically for CoxPH
The GBM algorithm estimates, via tree boosting, the additive
predictor
.
For CoxPH, this predictor is the log relative risk used in
the Cox partial likelihood, rather than a direct prediction of the event
indicator. For CoxPH, the algorithm calculates both the
partial log likelihood and martingale residuals
()
using the following approach. The algorithm walks backwards in time
until it encounters the “stop” time of an observation. When this happens
the weighted risk associated with that observation,
,
is added to the total cumulative hazard:
,
which is initialized at
.
Continuing backwards in time when we reach a time before an observation
was in the study, that is the algorithm leaves the associated time
segment (start, stop], the observation’s contribution to the cumulative
hazard is subtracted off. The algorithm is robust to overflow/underflows
occurring in
by subtracting a constant off of the risk score. This constant drifts to
ensure overflow does not occur.
This algorithm deals with tied event times using either the Breslow or Efron approximations. The method used is specified by the user but in the event of tied deaths, it defaults to the Efron approximation. It also allows for the introduction of strata and start as well as stop times for each observation, see the previous Sections.
As well as calculating the partial log likelihood the algorithm also calculates the martingale residuals. The risk scores are related to the covariate matrix, , via: The derivative of the partial log likelihood, , with respect to the parameter vector is related to the martingale residuals through: Defining the loss function as the negative of the partial log likelihood then using the chain rule in combination with Equation (1) the residuals are given by:
At this point the covariate matrix should only decide what splits the tree will make thus covariate matrix in Equation (3) is free to be set to the identity matrix and so:
Finally, the updated implementation calculates the optimal terminal
node predictions in the following way. Looping over the bagged
observations in the terminal node of interest the expected number of
events is given by:
.
The constant
represents the prior on the baseline number of events that occur within
a given terminal node; it can be set on construction of the
CoxPHGBMDist through the prior_node_coeff_var
parameter. From this the terminal node prediction is given by:
If prior_node_coeff_var is not set to a finite positive
double, the fitted model’s predictions can become nonsensical.